How does statistics work?
All information on posts published by POSTOPLAN can be found in the “Statistics” tab on the left side menu:
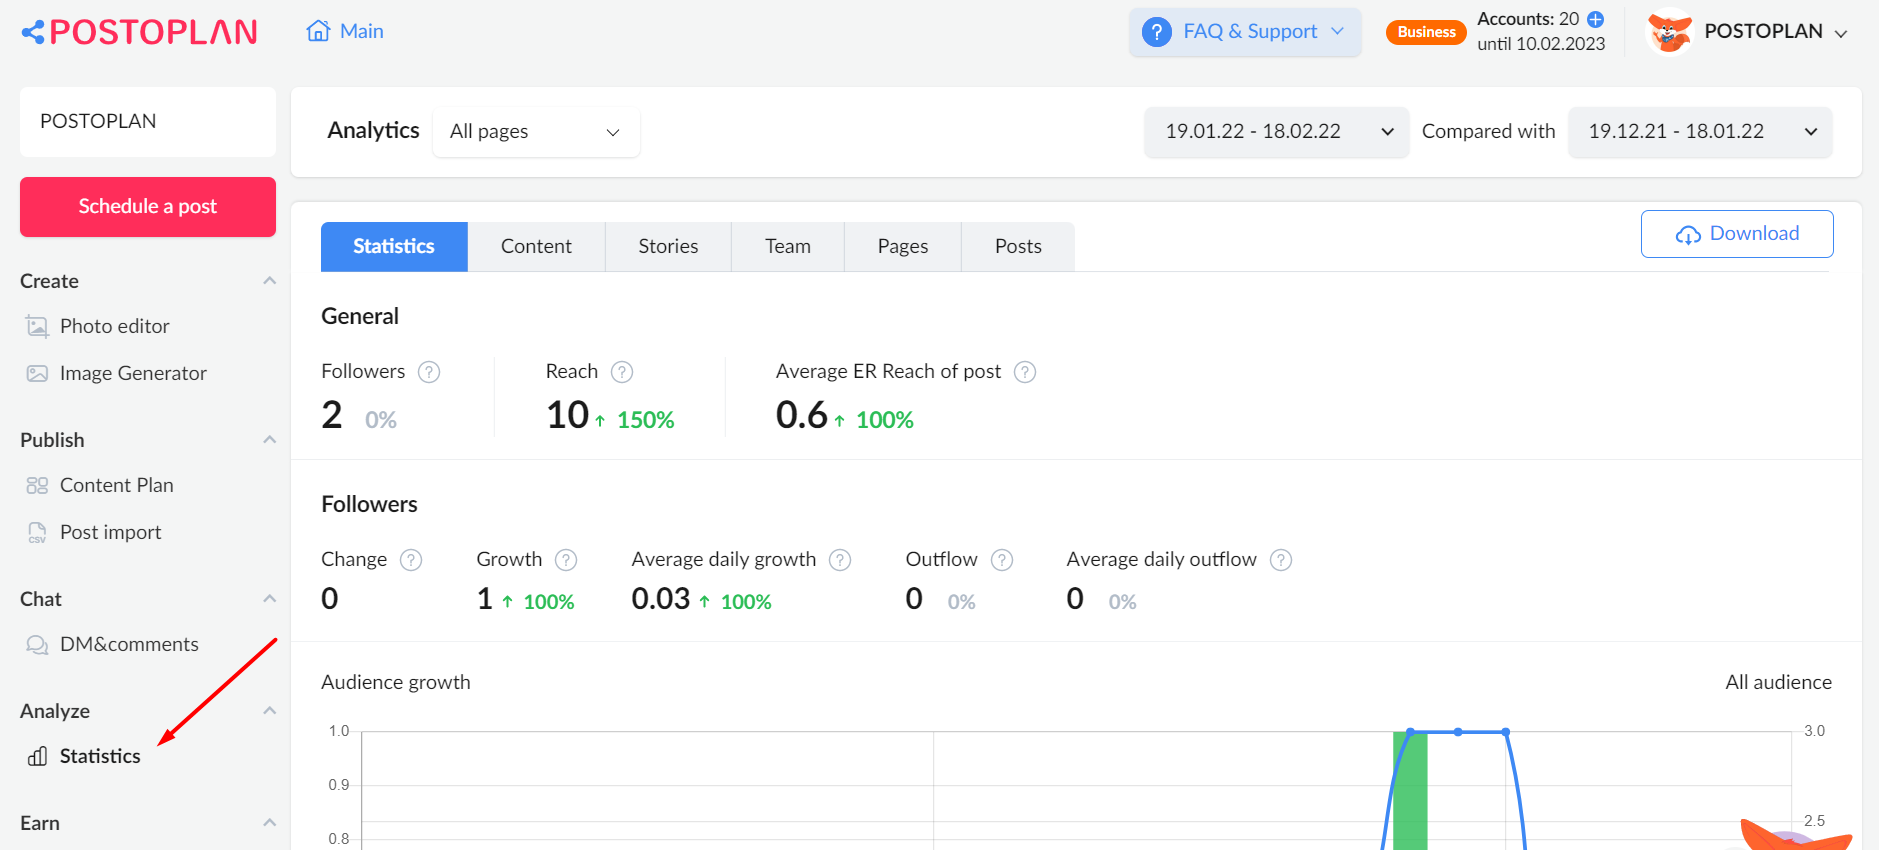
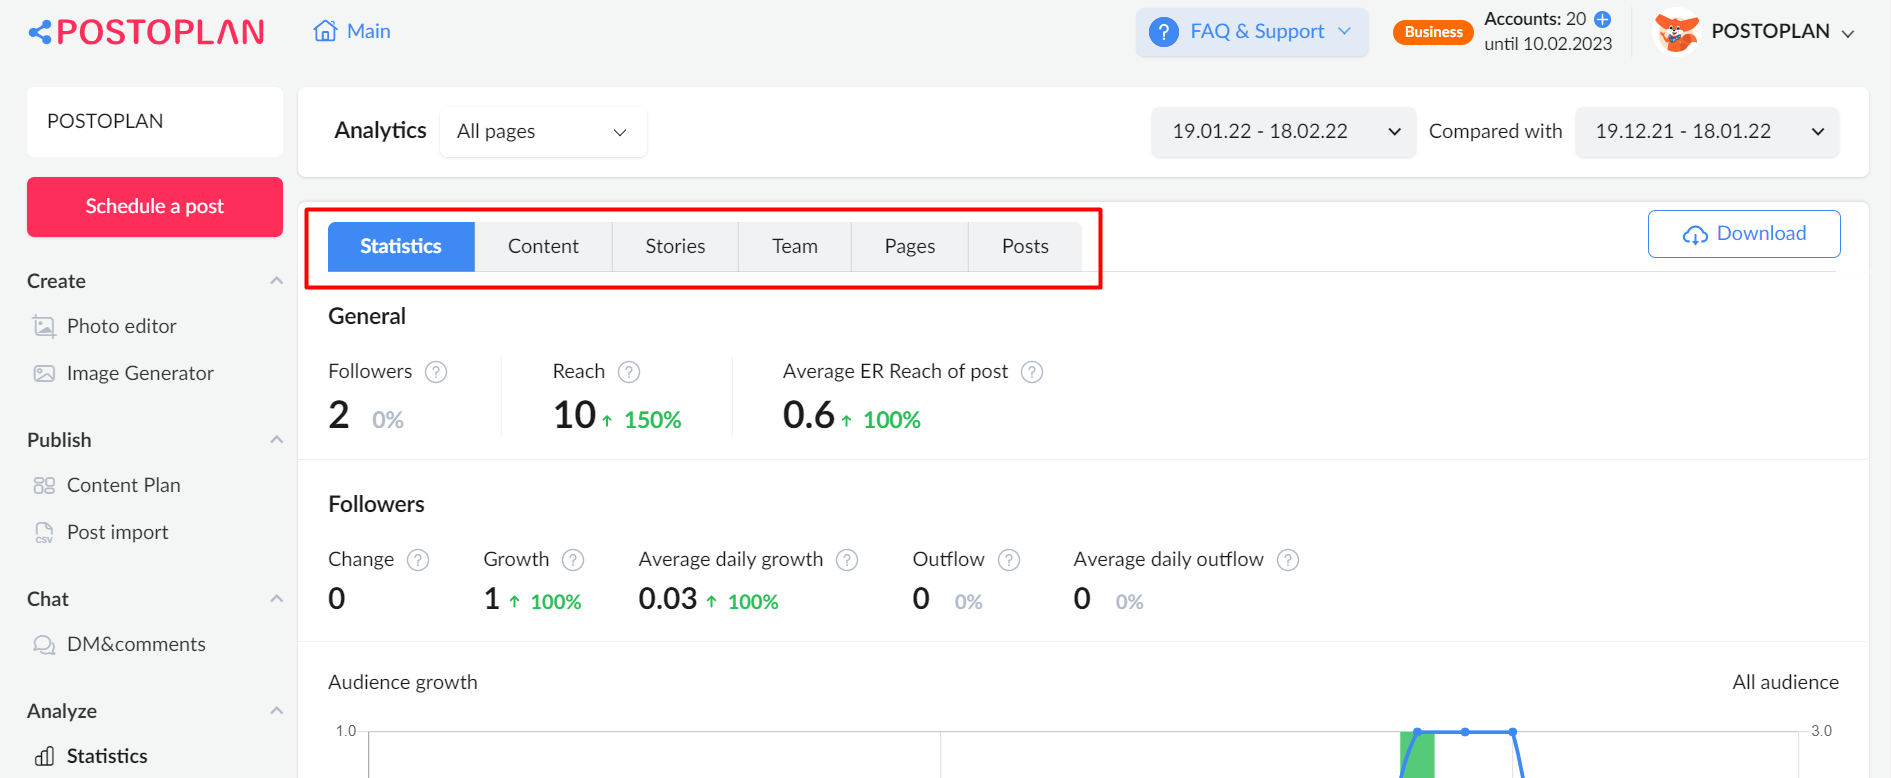
The “Statistics” tab consists of six subsections including “Statistics”, “Content”, “Stories”, “Team”, “Pages”, and “Posts”:
In “Statistics”, you will find three graphs.
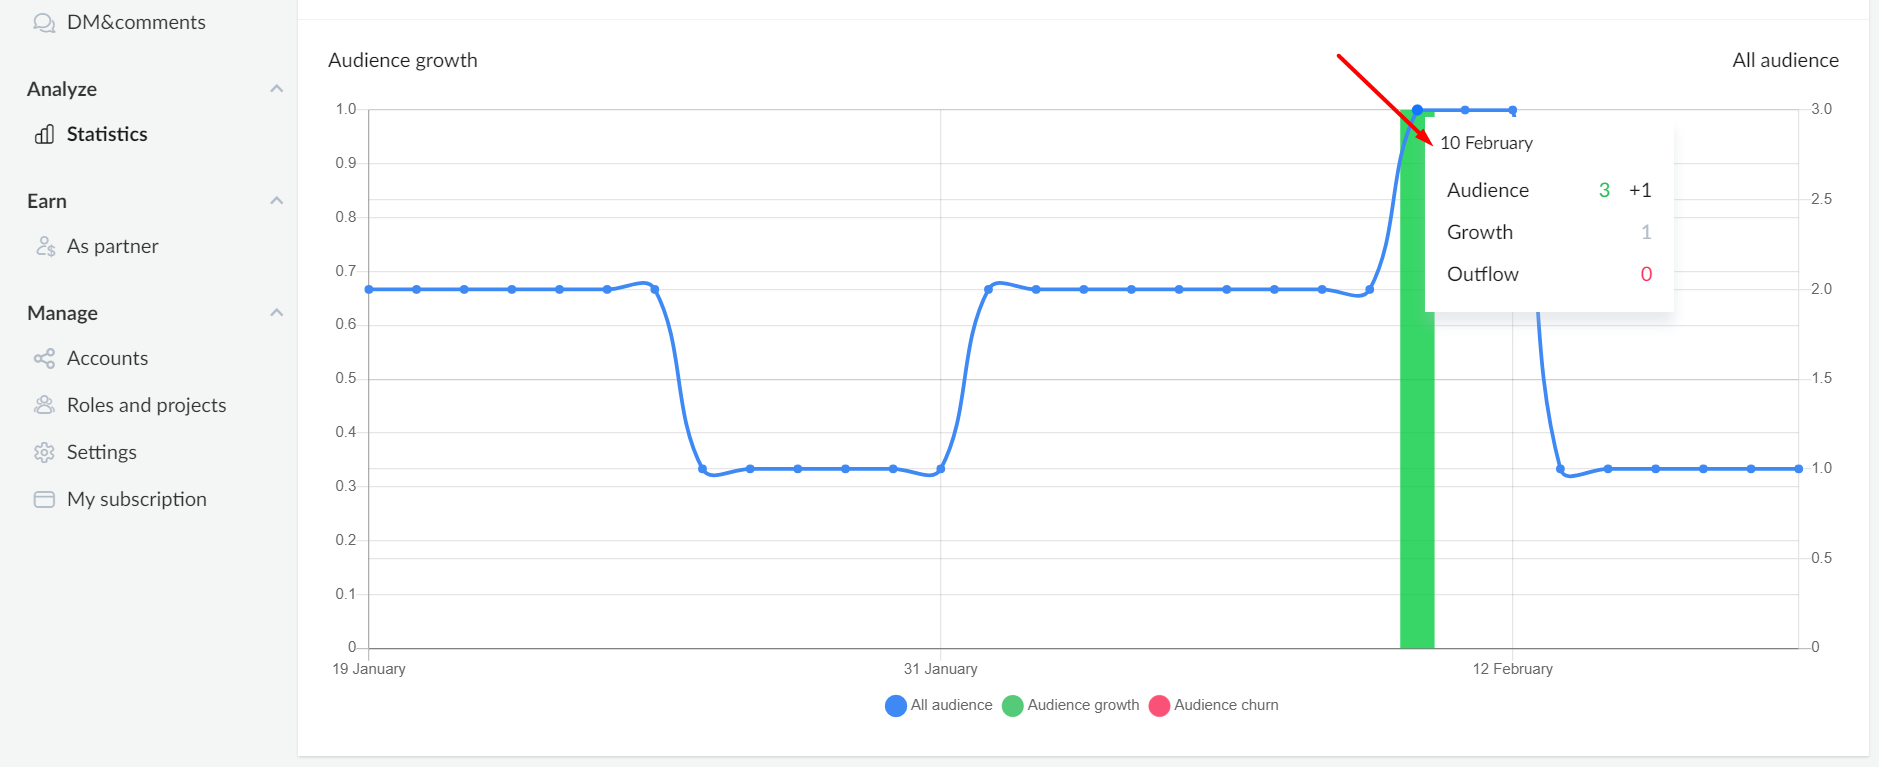
The first graph is “Audience Growth”:
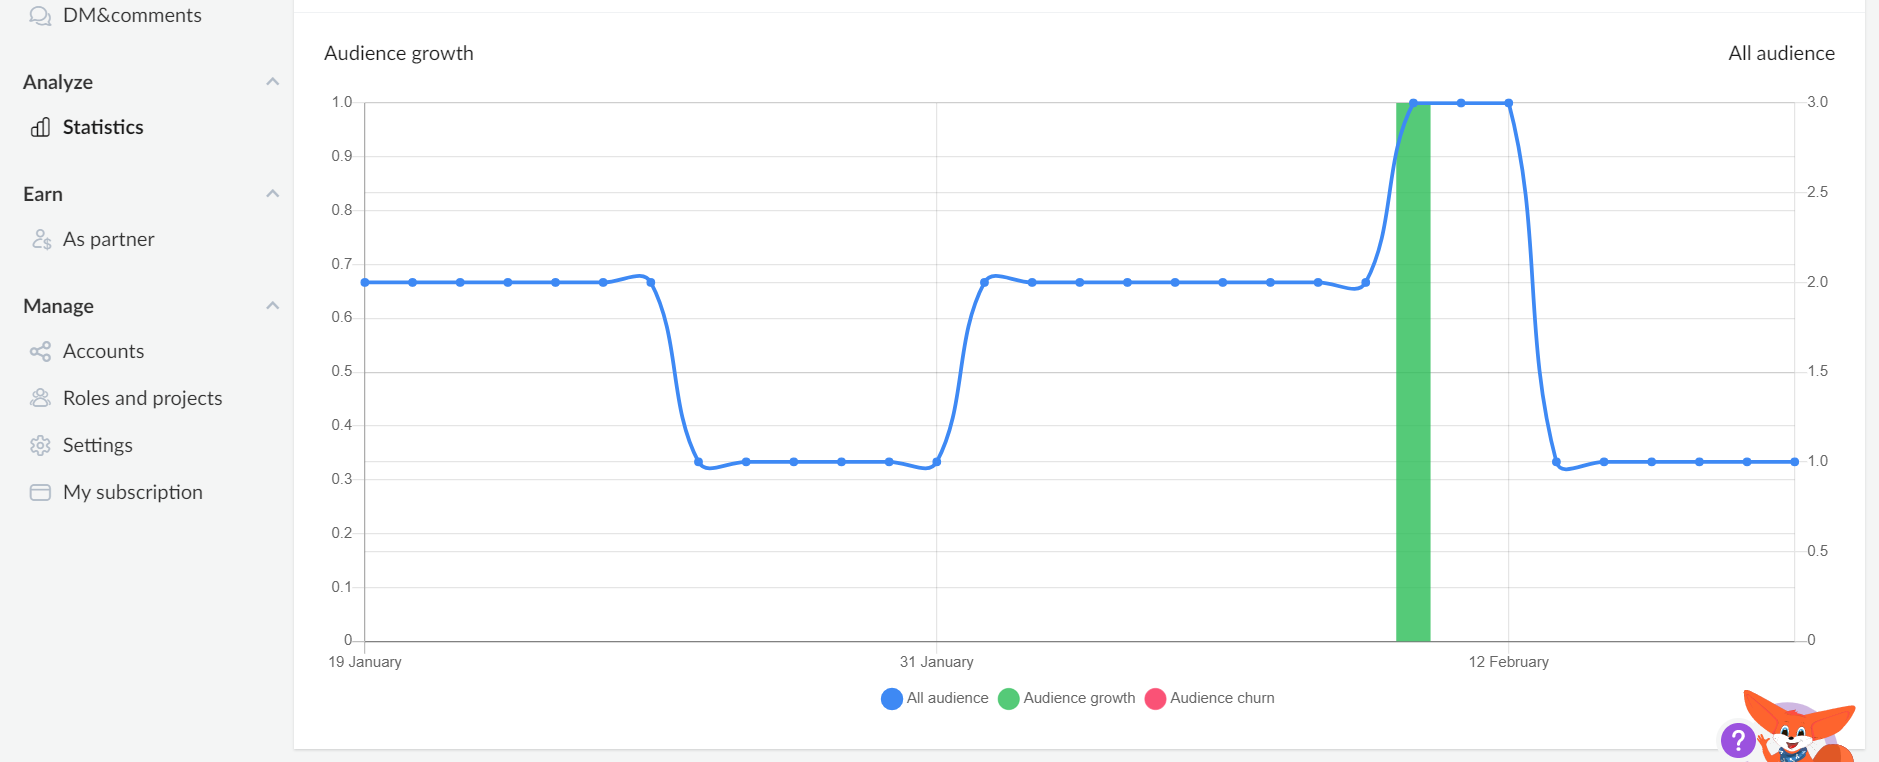
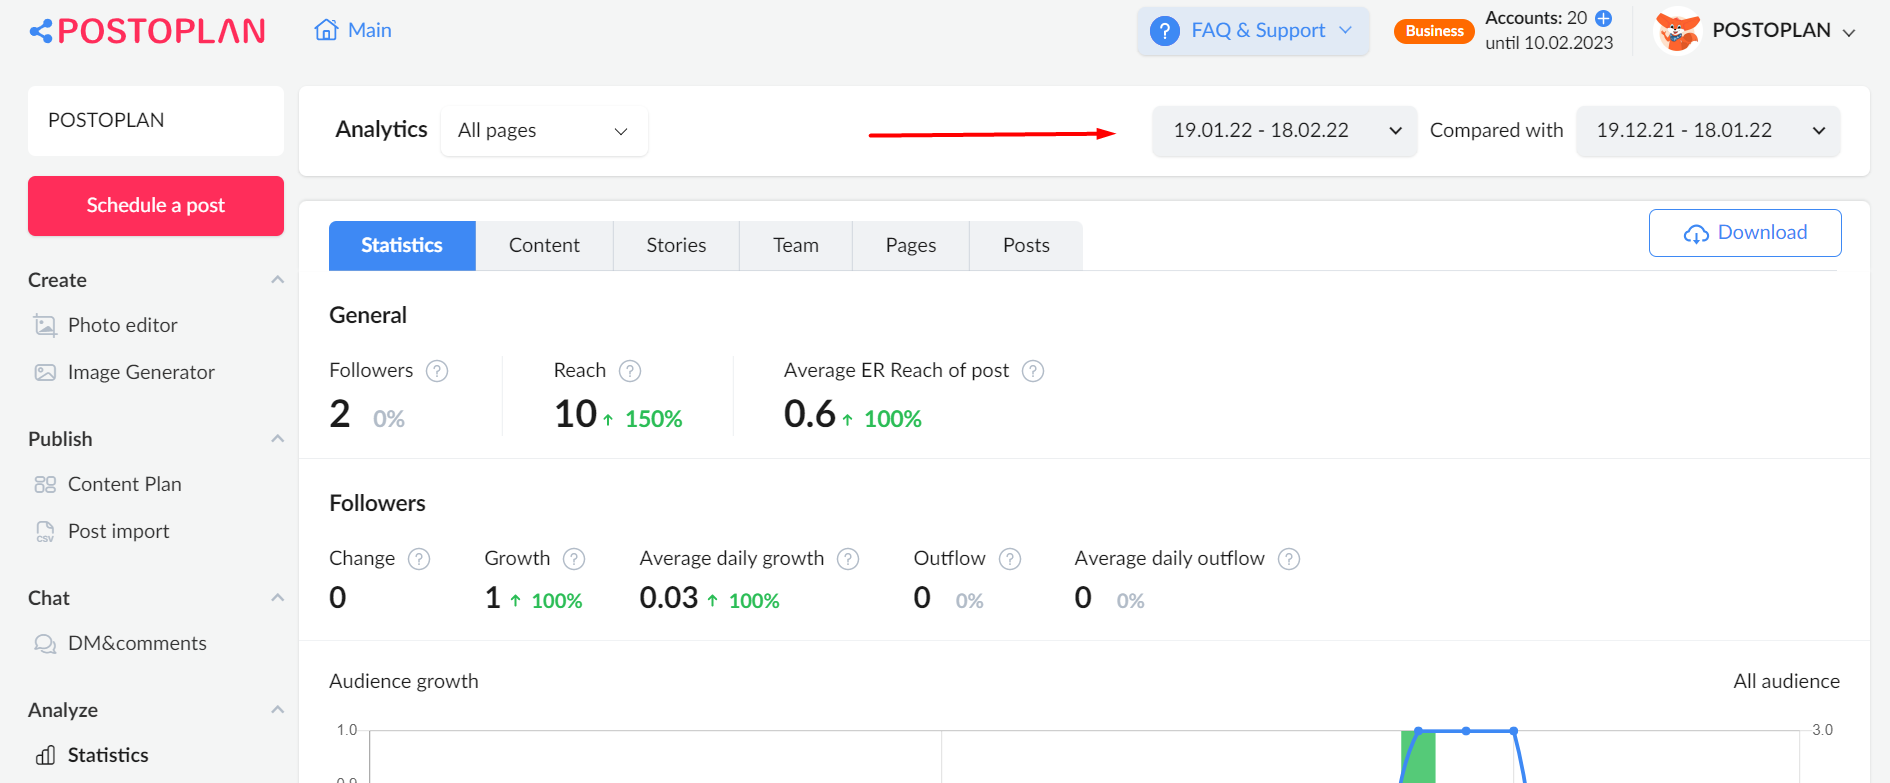
The points on the graph relate to calendar days over a particular period. You can set the time period in the upper right corner, right under “FAQ & Support”.
Place your cursor on a specific point and the graph will show the state of the audience on that particular day. The audience growth is shown in green. The audience outflow is shown in red.
The second graph is “Reach”:
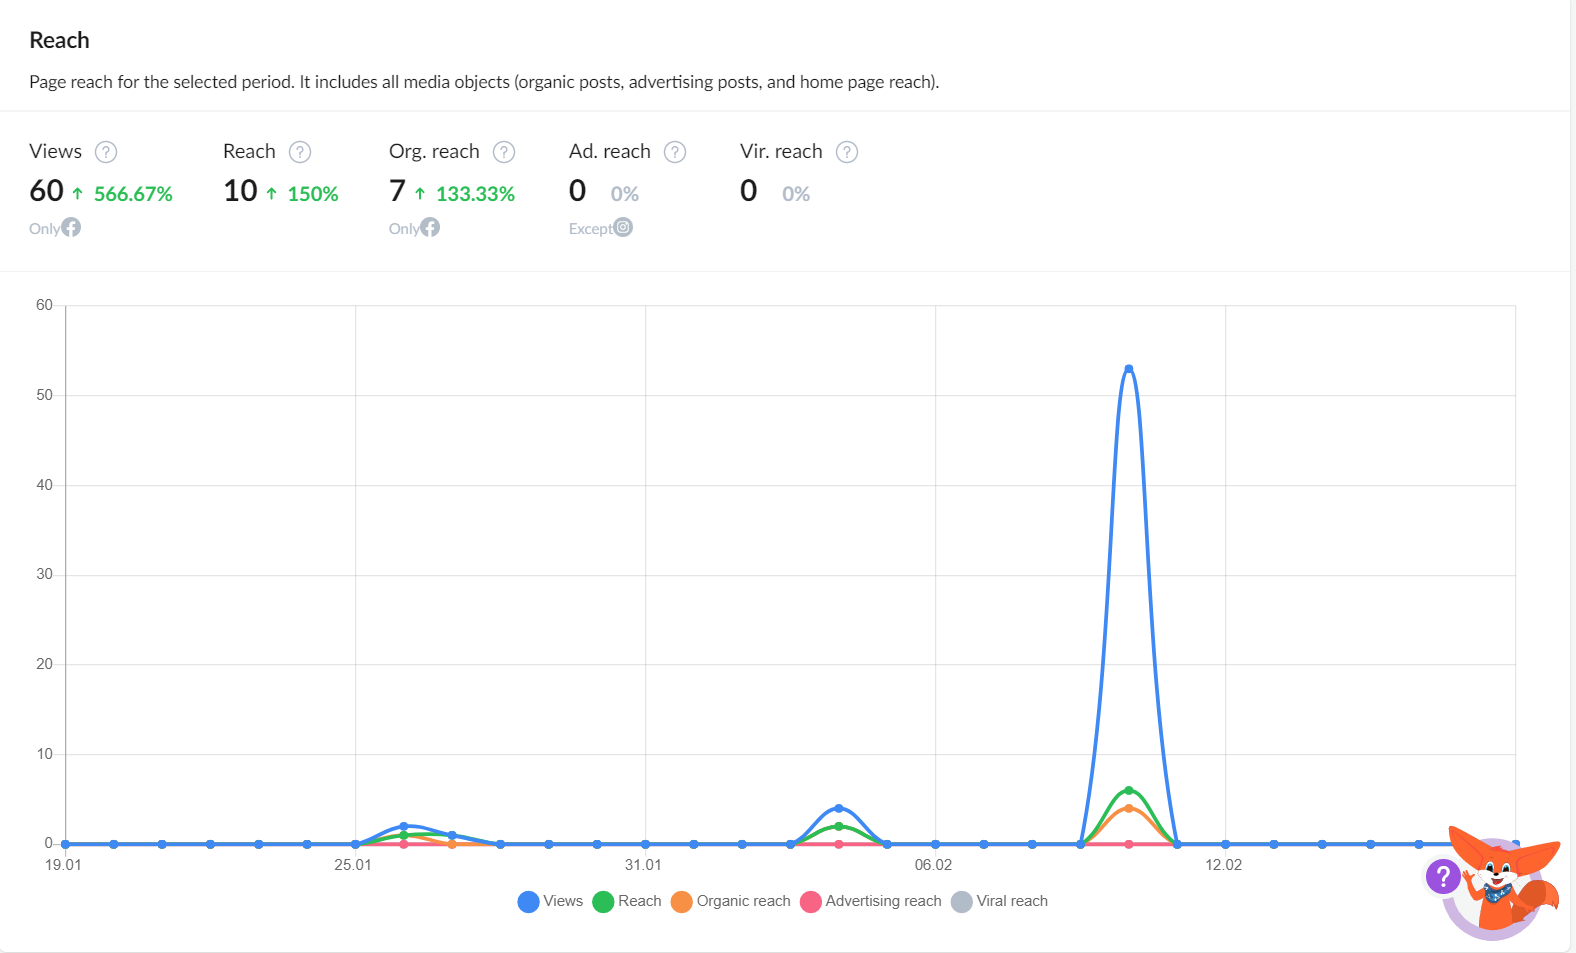
This graph shows the reach of the page over a particular period. Place your cursor on a specific point and the graph will show you the reach of all media for organic posts, advertising posts, and the home page.
The third graph is “Activity”:
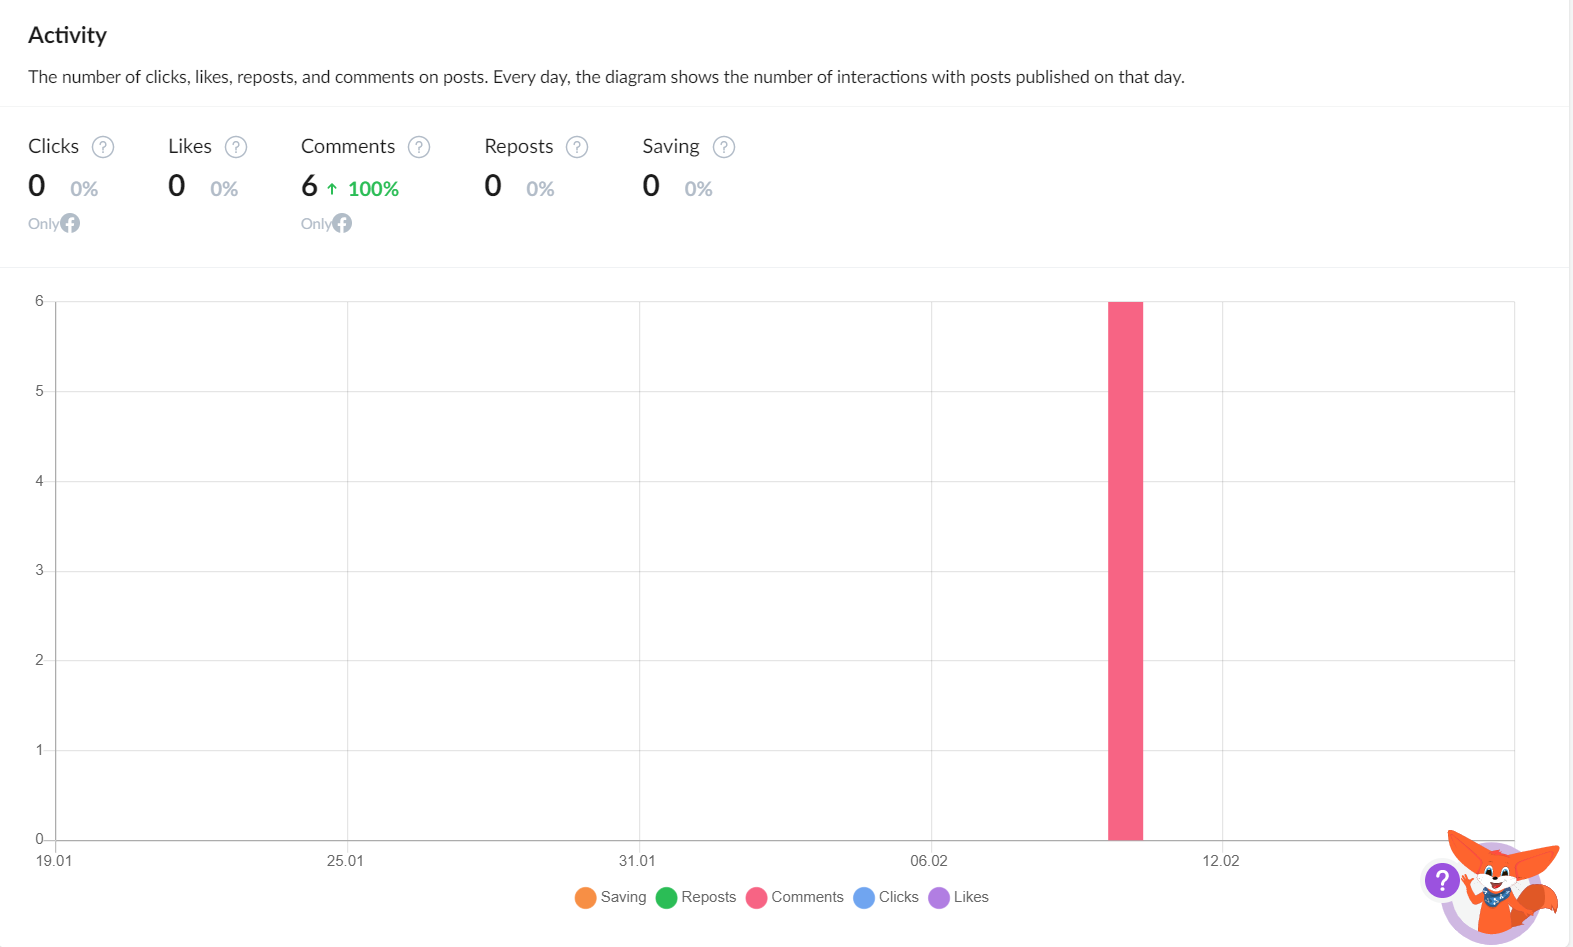
“Activity” allows you to see all interactions with published posts (clicks, likes, comments, etc.) for each day of the month.
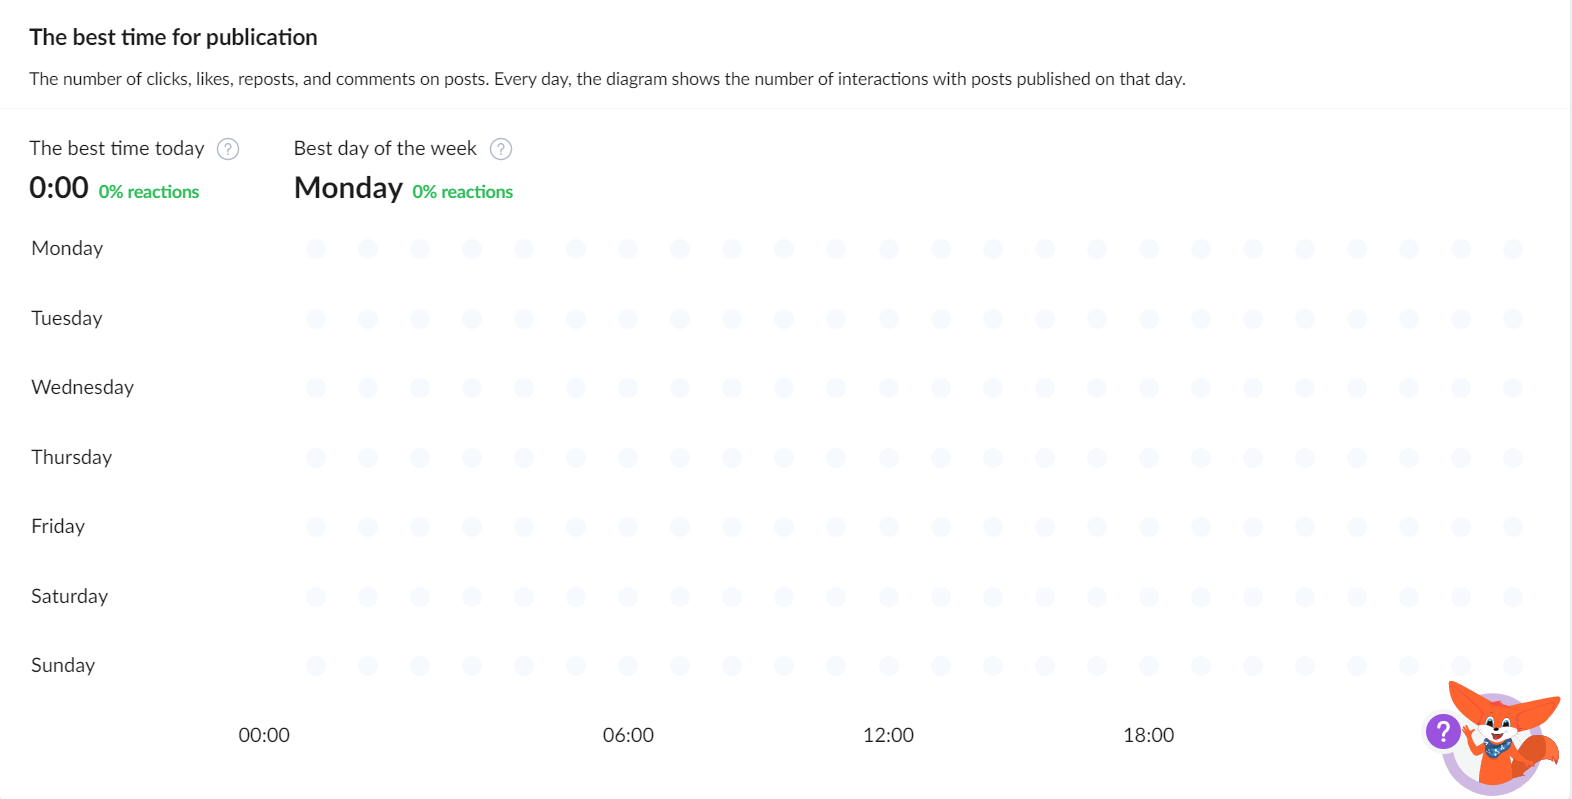
In addition to the graphs that provide reports about work already completed, in “Statistics” you can find a graph with estimates on the best time for a particular post.
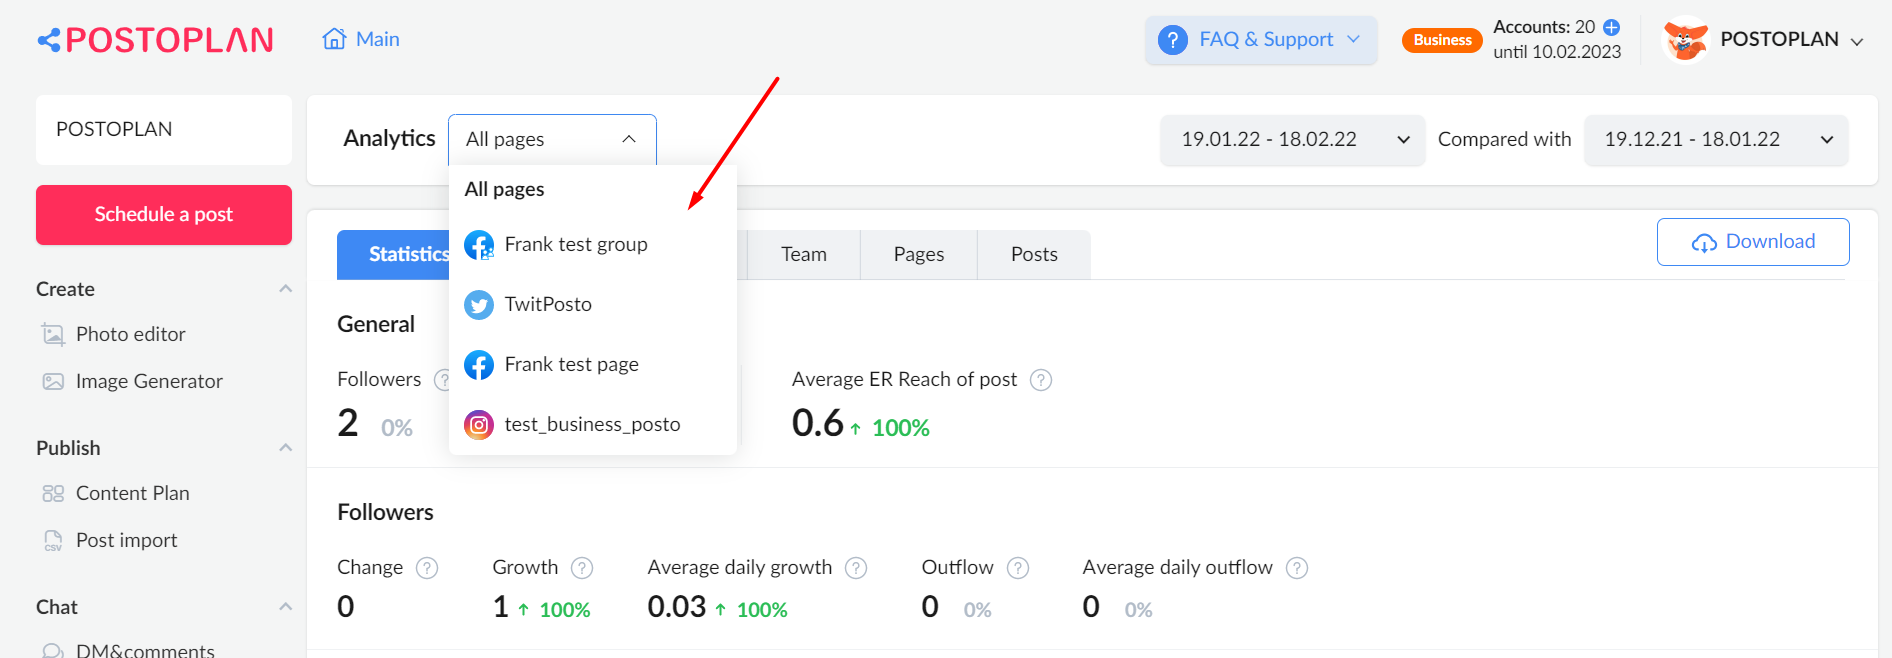
Although the charts show general statistics for all connected accounts, you can always select a specific account from the drop-down list:
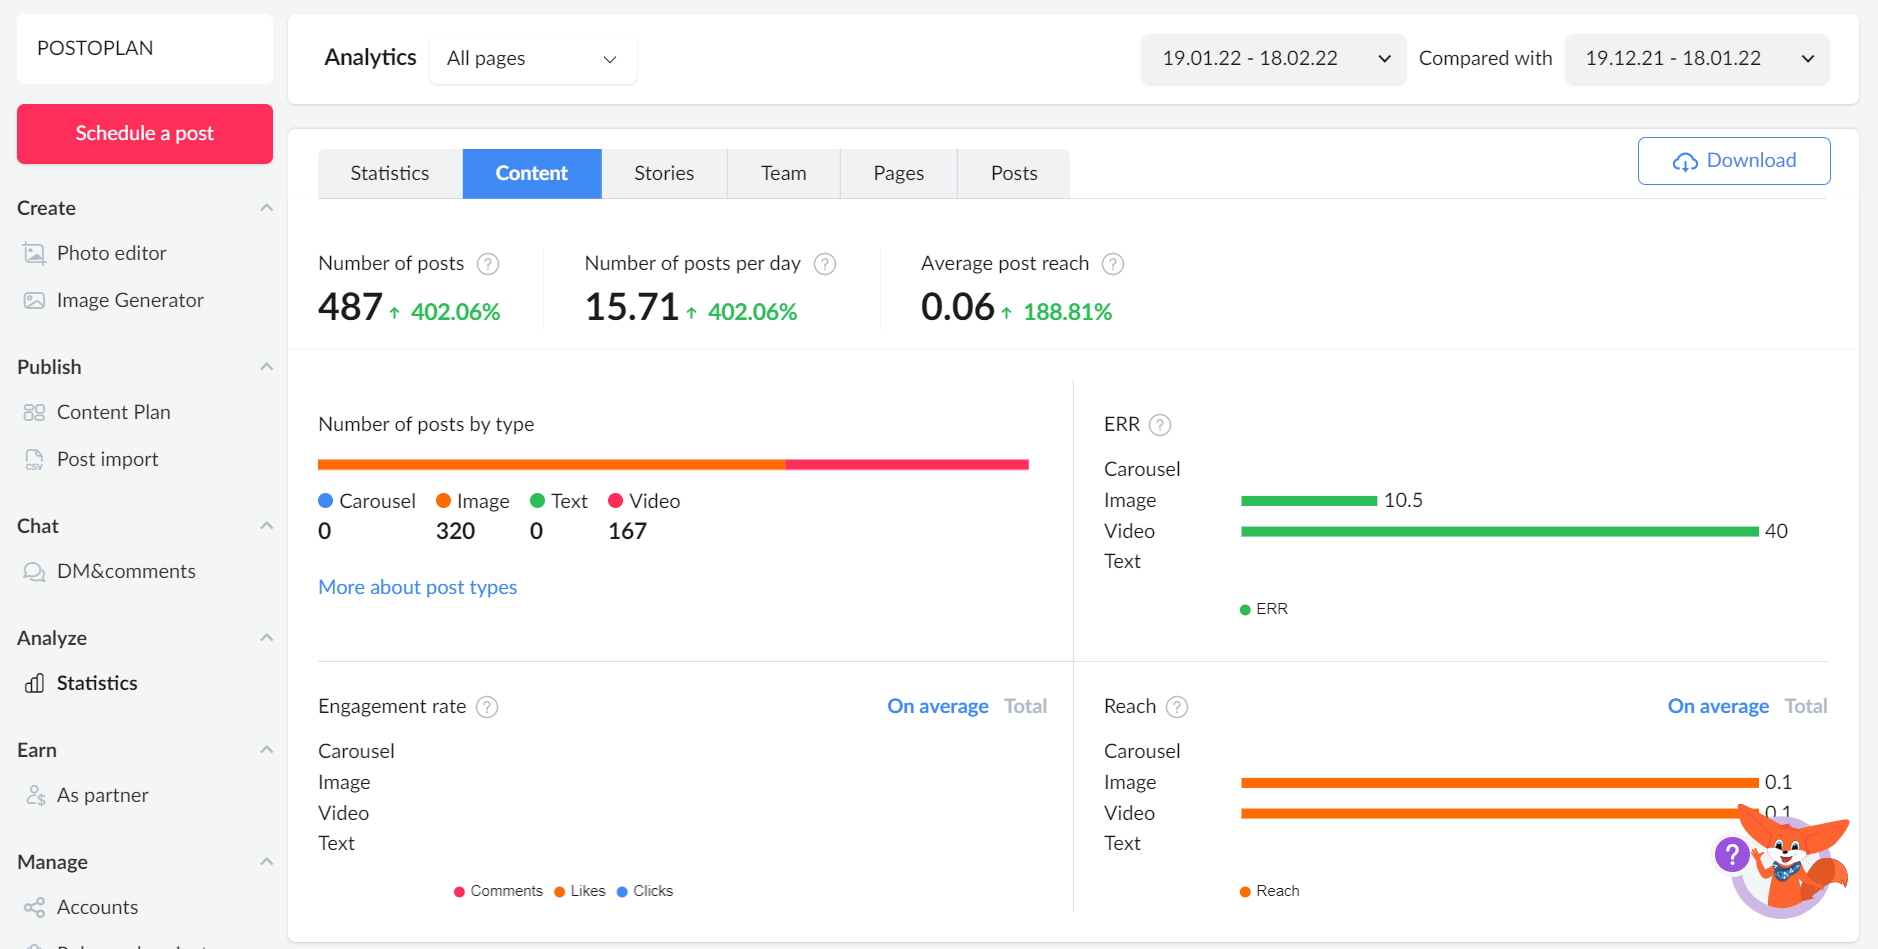
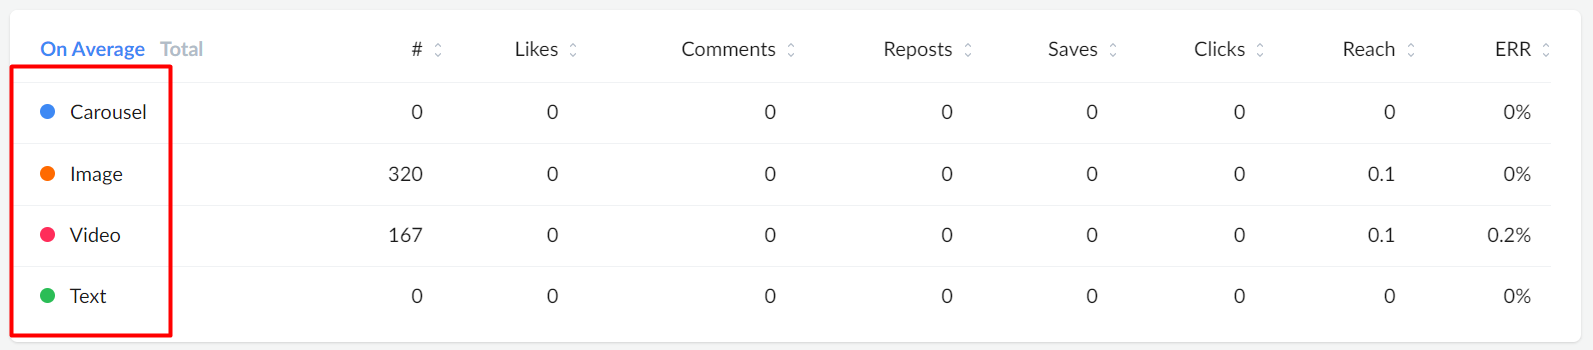
“Content” provides you with all the information you need about the number of your posts and the audience they reach. For your convenience, the posts are grouped by type: “Carousel”, “Image”, “Video”, “Text”:
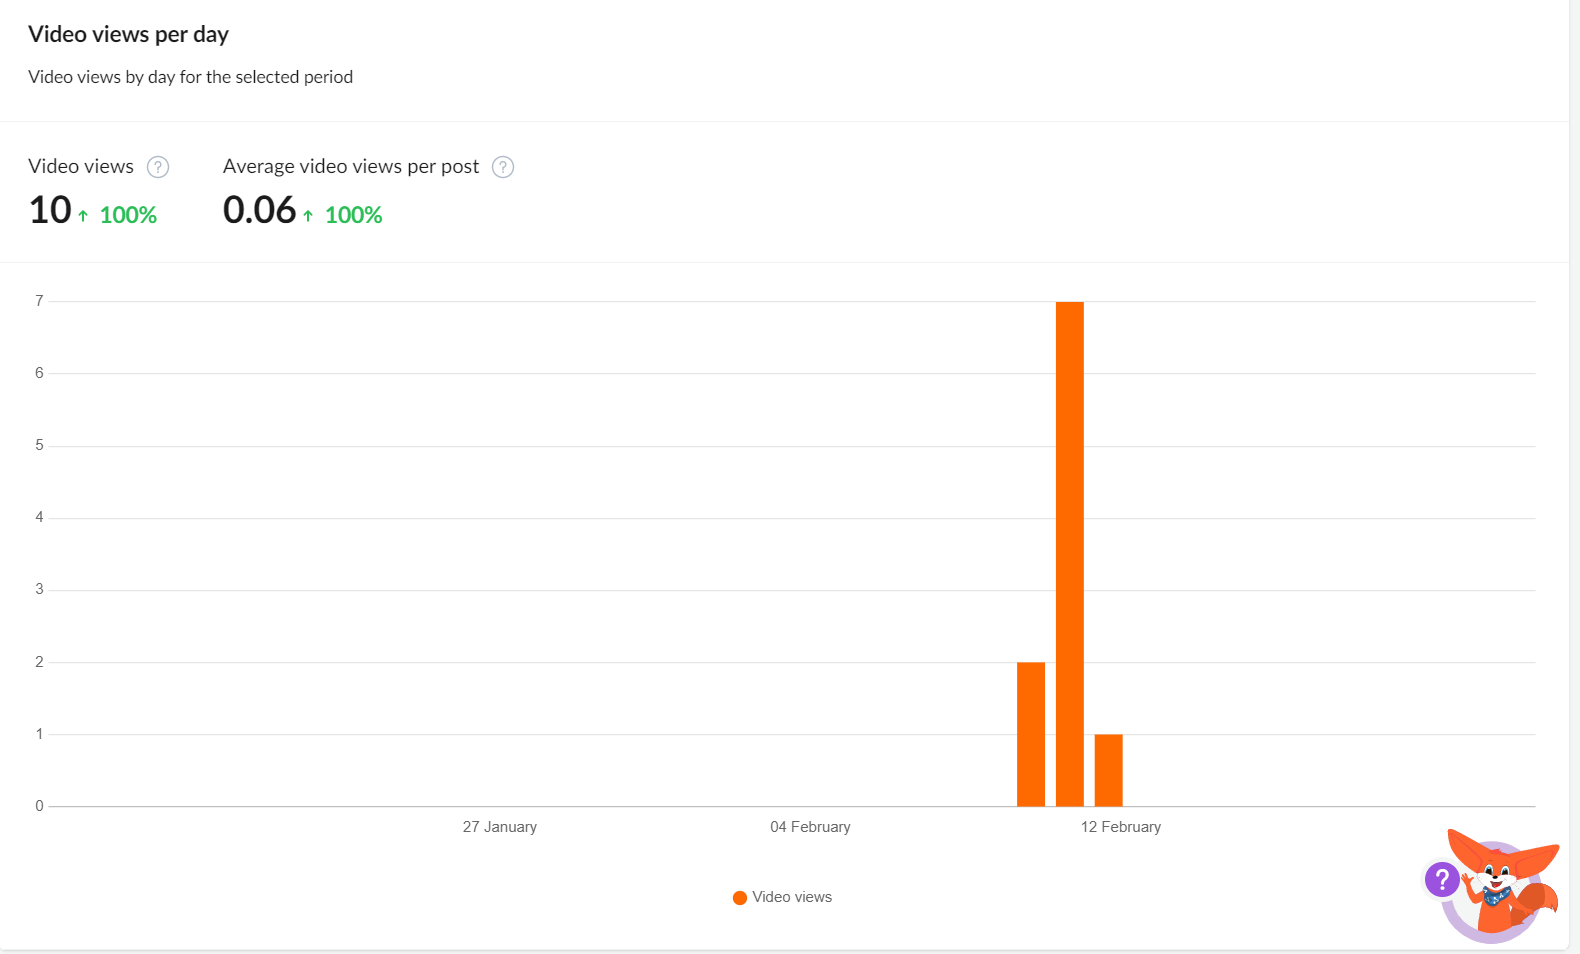
In the same subsection, you can find a graph displaying video views per day for a certain period of time:
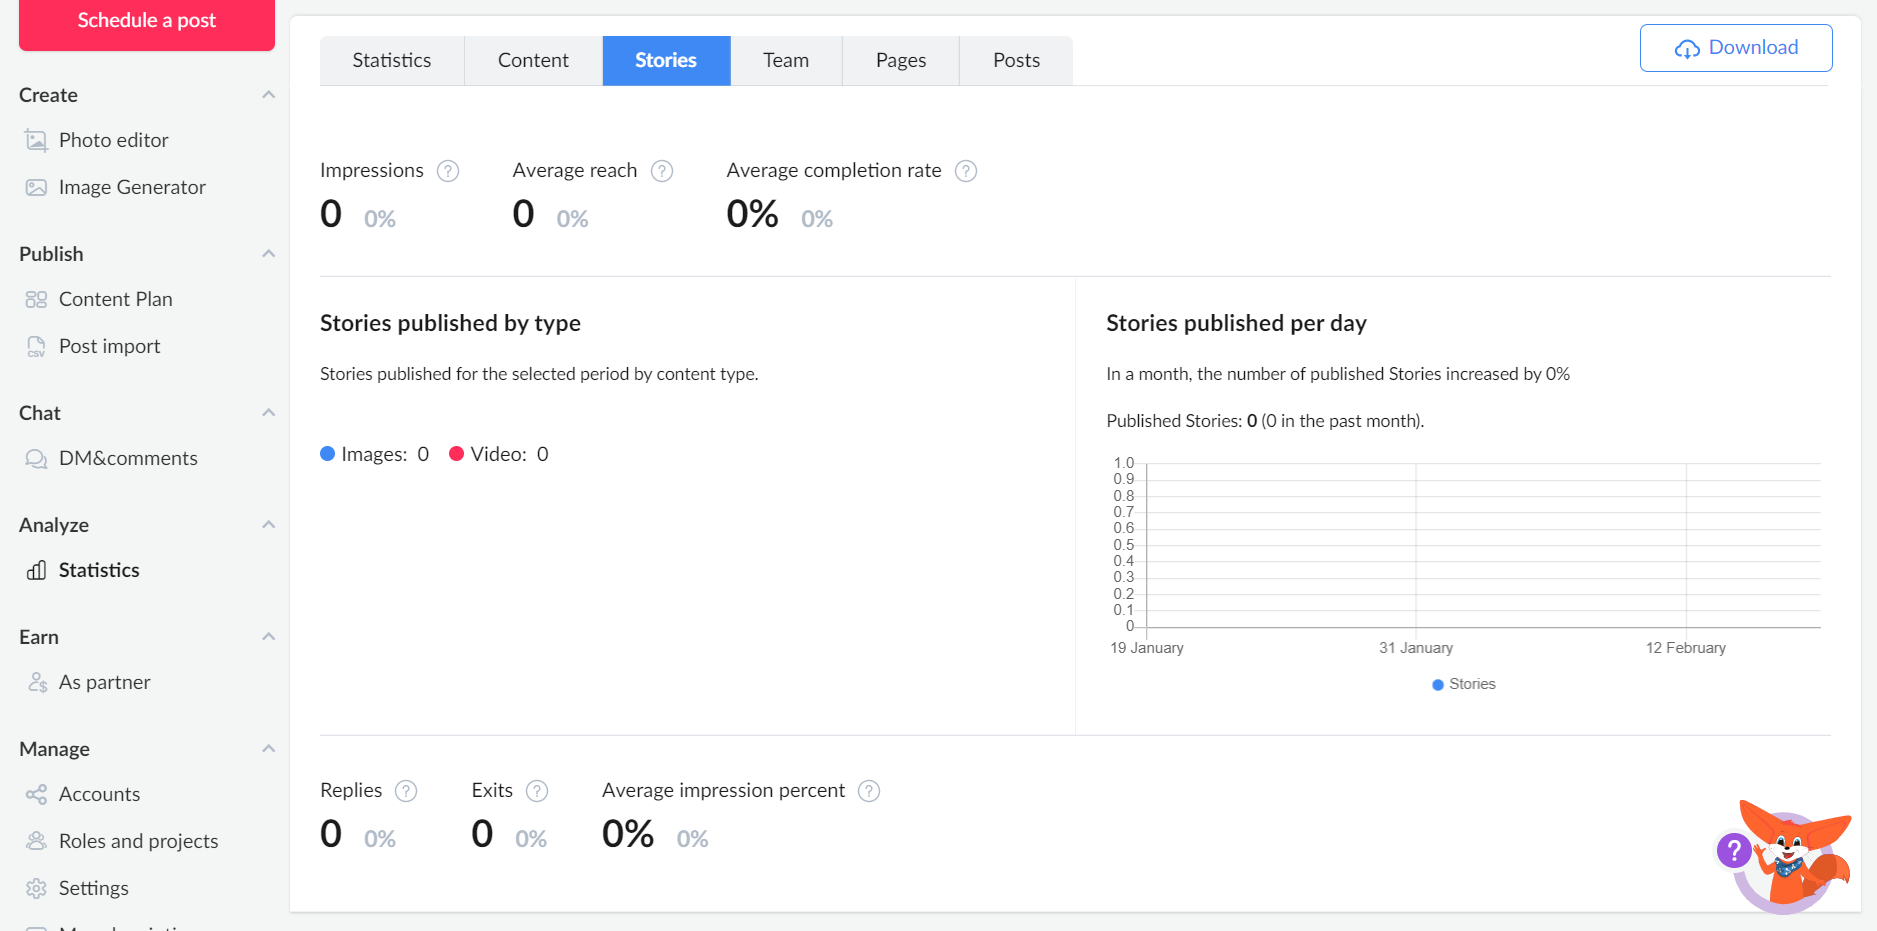
All information regarding your stories can be found in the aptly named subsection. In this subsection, you can see the number of stories posted for a certain day as well as their reach, views, and average completion rate.
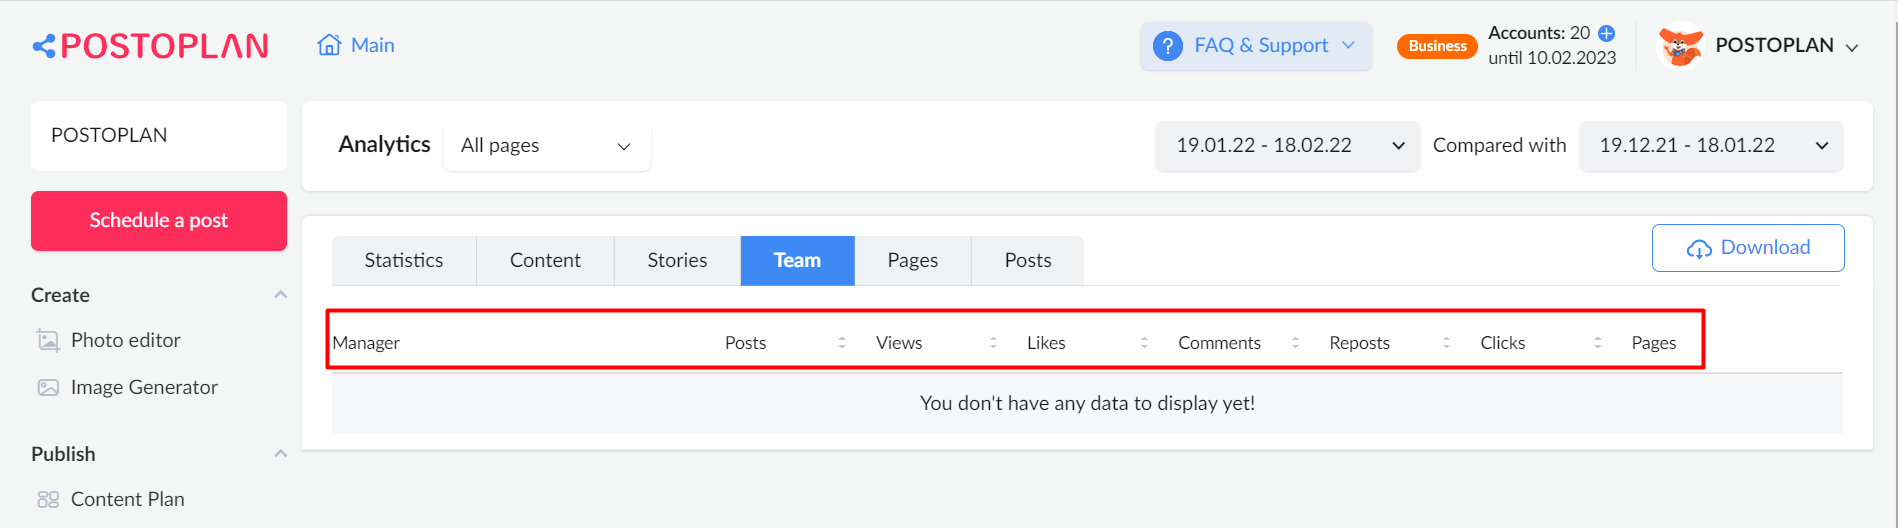
In the “Team” subsection, you can find statistics on projects led by your team members:
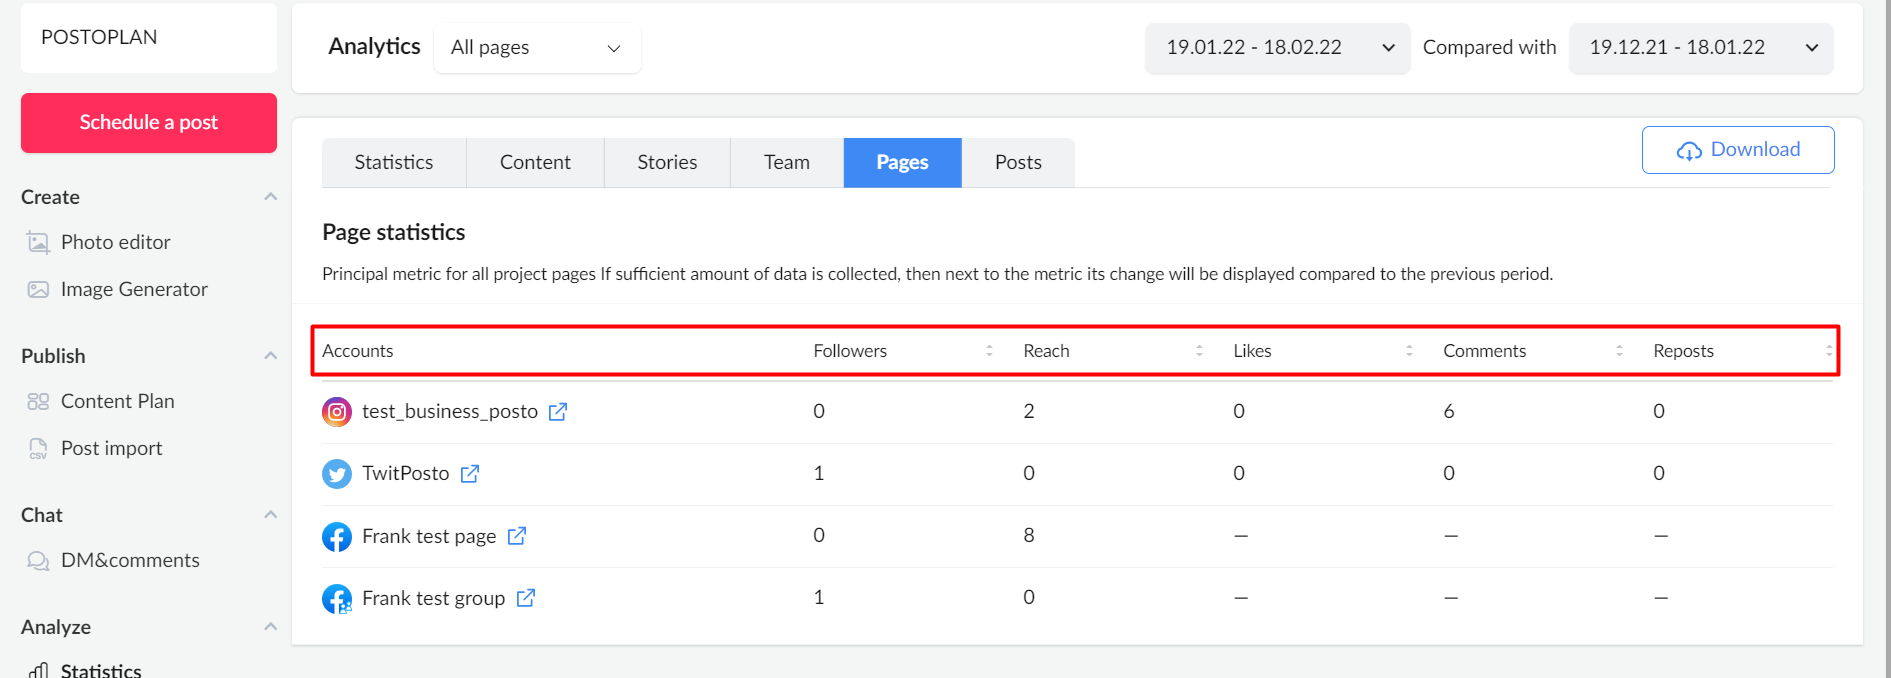
“Pages” shows you the most important metrics for all project pages. Here you can select a particular page and view its subscribers count, reach, as well as the number of likes, comments, and reposts:
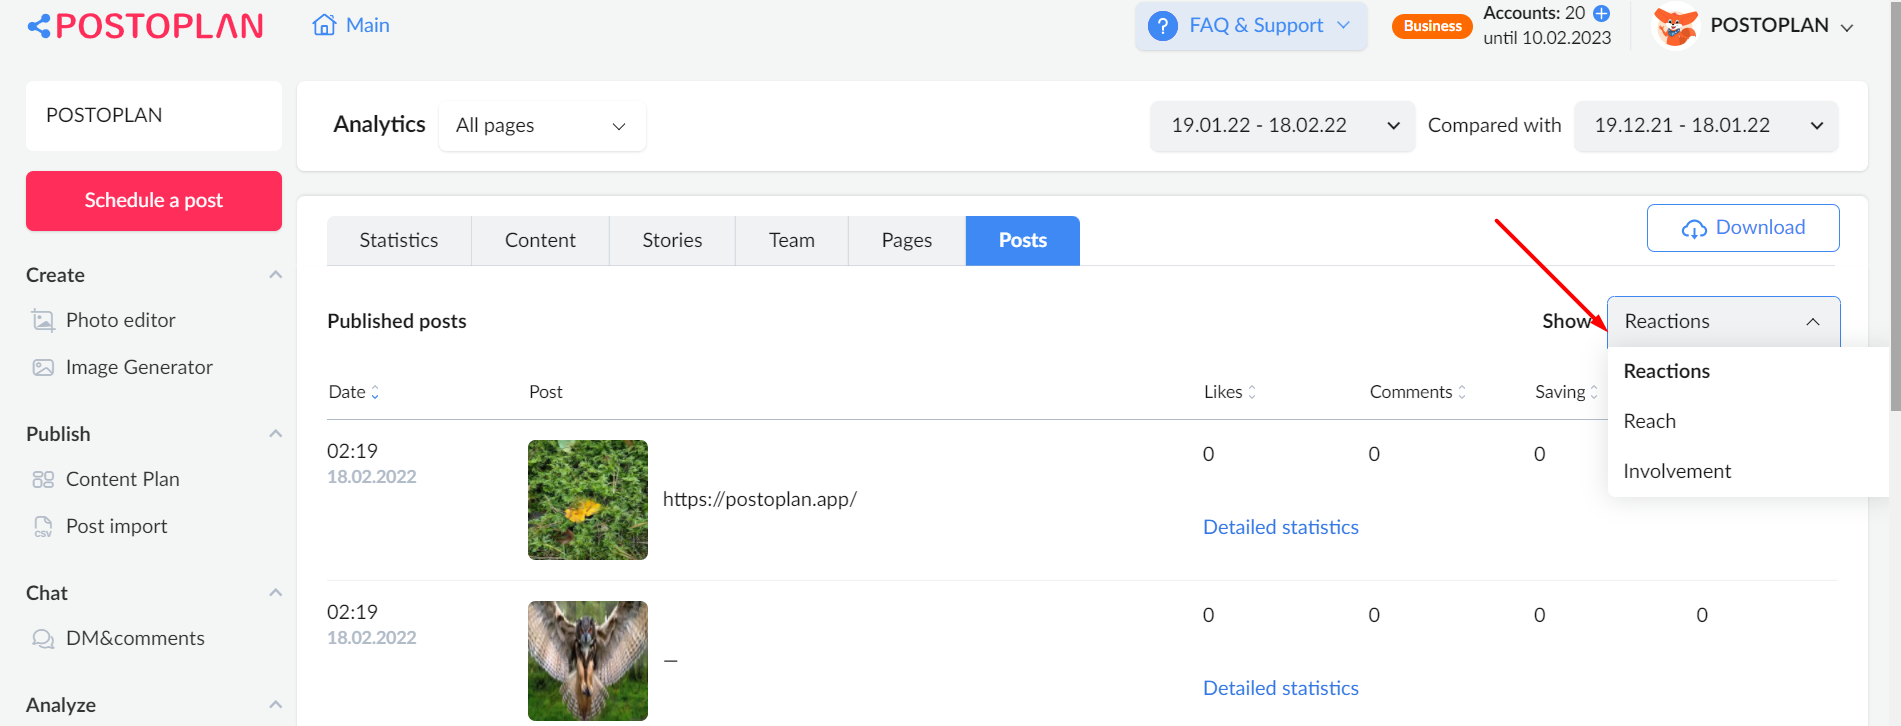
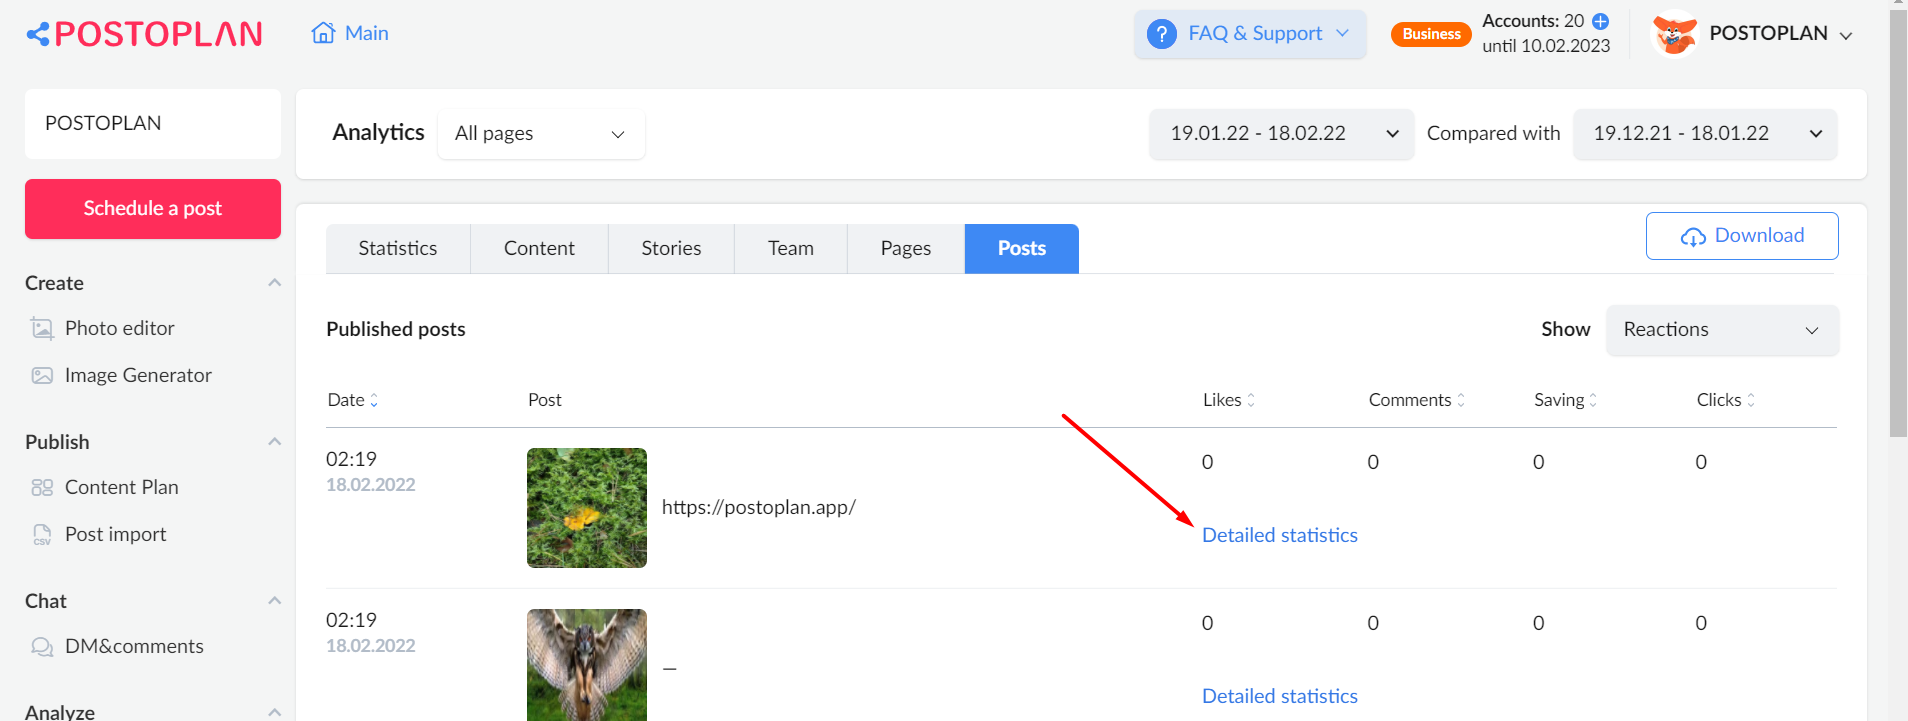
In “Posts”, you can find detailed statistics on all the posts you’ve published. Post statistics can be quickly systematized by selecting “Reactions”, “Reach” or “Involvement” in the drop-down menu:
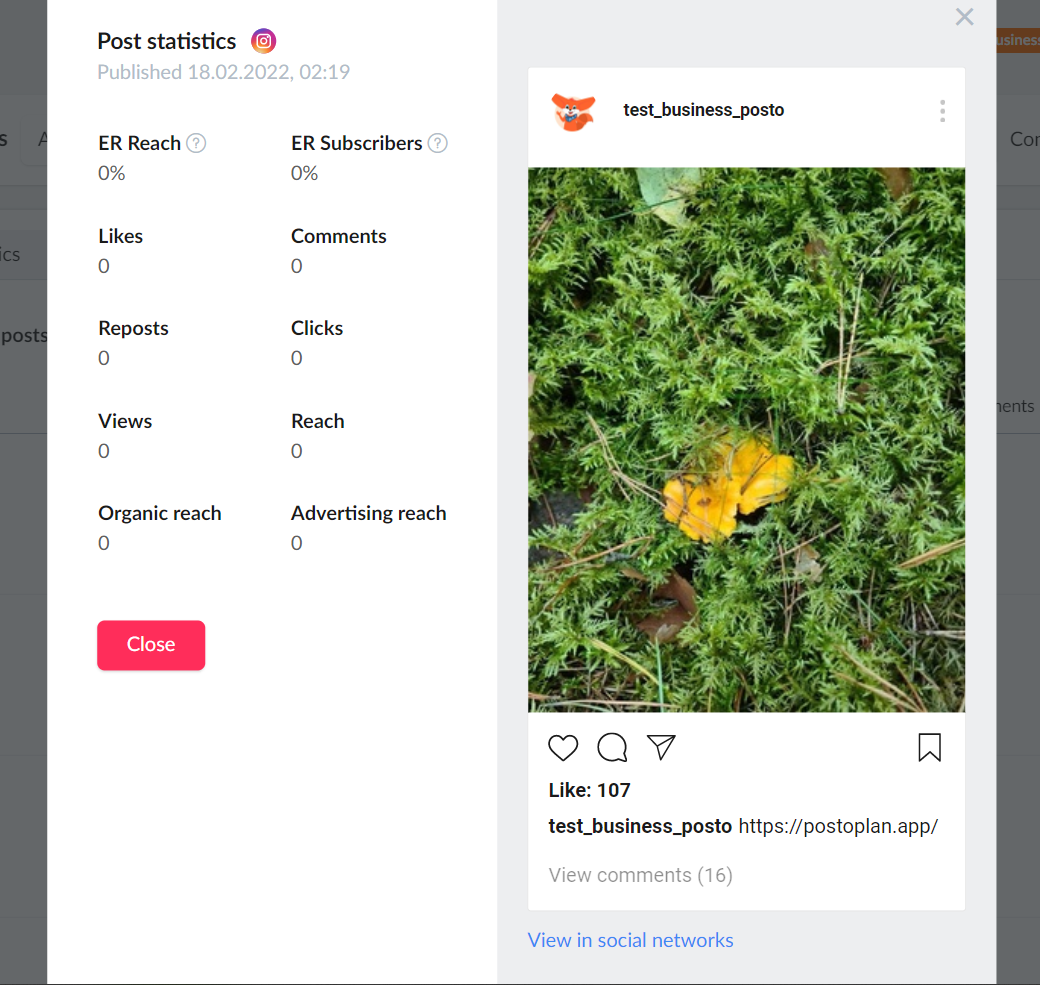
You can also see the statistics for a particular post:
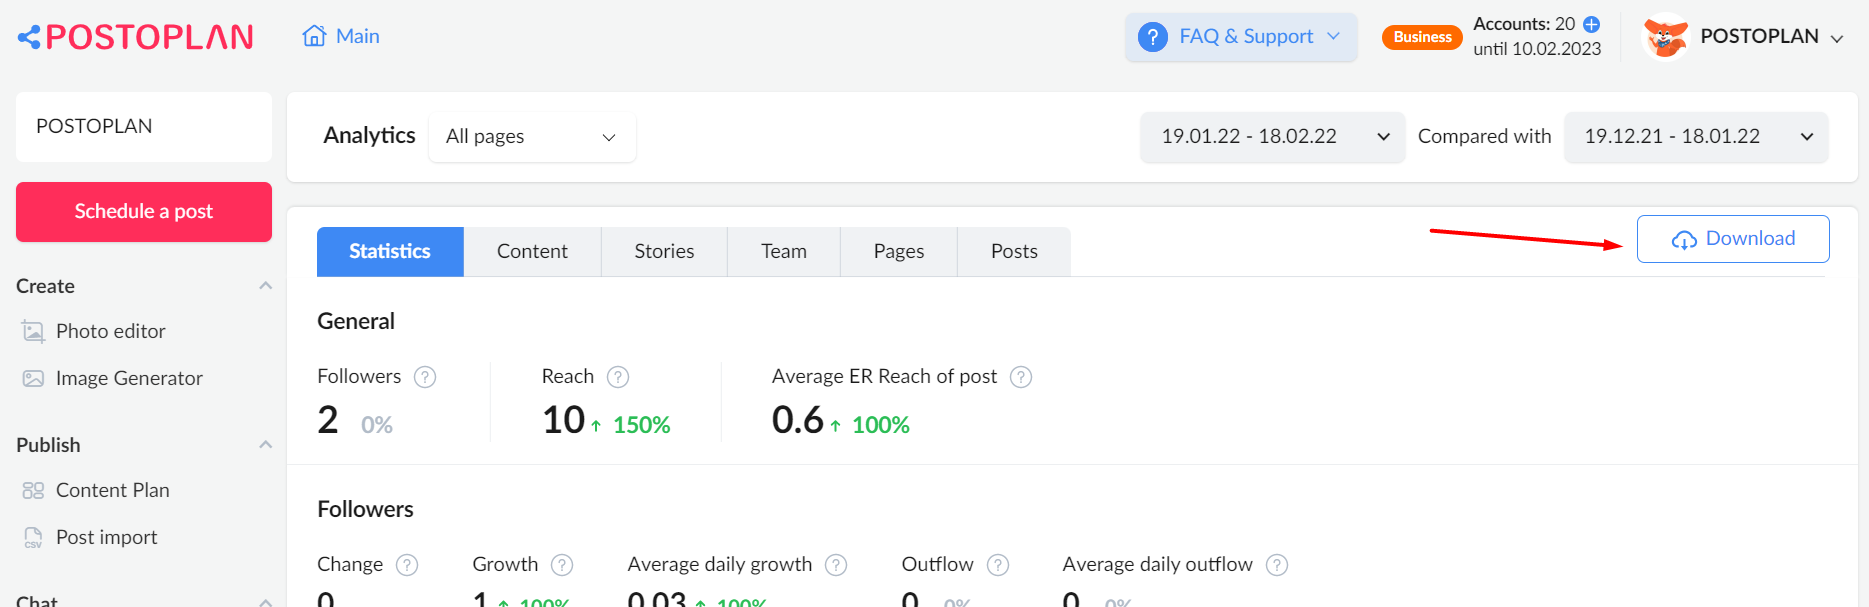
You can download these statistics as a PDF file or print it. Click on “Download” in the upper right corner:
How statistics are collected:
-
- For posts published for the last 3 days, statistics are collected every 3 hours.
- For posts published more than 3 days ago, the data is updated once a week, on the day of the week on which the post was published.
For which social networks statistics are collected?
Statistics are collected for Facebook Pages and Groups, Twitter, and LinkedIn Companies.